How is your business performing on social media? There are a lot of analytics options out there to check out how your company’s site is doing. Whether you’re using Google Analytics, Kissmetrics or Hubspot for your website analytics, it’s also important to check out your platform-specific social media metrics.
These social analytics are not only beneficial to marketing teams, they help them demonstrate their company's social media ROI to the C-Suite.
Here’s a quick guide to using the social media analytics available on LinkedIn, Twitter, Google+, and Facebook.

1. LinkedIn
LinkedIn is a great platform, especially for B2B businesses. If you haven’t already, create a group relating to your industry that’s not yet on LinkedIn. If you already have a group, it’s important to review your analytics. Here’s how:
Once you’re in your group, hit the gear icon on the top right-hand side. From the drop-down menu, hit “Group statistics.” You will then be able to see a statistical summary, demographics, growth, and the activity of your group.
In the Summary tab, you’ll be able to access information like how many members are in the group, the seniority of members’ jobs (including entry-level, manager, senior, director and owner), the number of comments made in the previous week, and the most popular location and function of members.
In the Demographics tab, you can see more specific information regarding member industry, location, function, and industry. This information allows you to target specific members or post content you know will resonate with the majority of your audience.
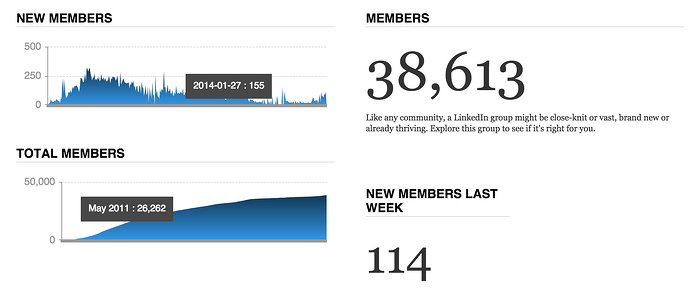
Check out the Growth tab to view charts of new and total members who’ve joined over time, how many new members have joined in the last week, and your group’s week over week growth rate.
Lastly, use the Activity tab to see the number of comments made and discussions that have taken place over the past week.

2. Twitter
If you haven’t checked out Twitter Analytics yet, head on over to the site and log in using your company’s Twitter account. Once you’re logged in, you’ll be taken to the analytics dashboard. From here you can view tweet activity, your followers, and how your Twitter Cards are performing (if you use them).
Twitter Analytics allows you to measure the engagement of individual tweets by giving you information regarding impressions, engagements, and the engagement rate of each individual tweet.
You can also learn how to make your tweets more successful. If your best performing tweets include photos, quotes, or videos, you’ll know to include more of that content in your Twitter strategy.

If you sign up for Twitter Ads or currently use Twitter Cards, the metrics also allow you to explore the demographics, locations, and interests of your most engaged followers, giving you a more in-depth look at your target audience.
Lastly, the dashboard also has options for mobile app promotion and conversion tracking under “Tools.” The latter, used in conjunction with Twitter Ads, requires you to create a website tag to compare, analyze, and optimize your campaigns and measure the ROI of your ads.

3. Google+
Using the Insights for your business page on Google+, you can view statistics about your page’s visibility, engagement, and audience. If you have Google Analytics set up for your website, you can also see those metrics from your Google+ business insights page.
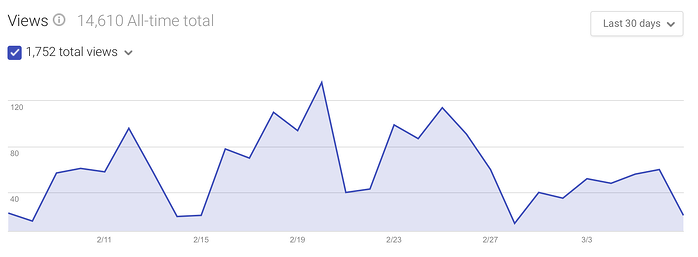
From your My Business home, hit “view insights.” Under Visibility you’ll see your page’s total views, defined as how many times both your page and content were viewed. You can also access information on how many post, profile, and photo views you’ve had over a seven-day, 30-day, 90-day period or for all time.
Under Engagement you can view how many actions, including comments, shares and plus ones, you’ve had on your posts. You can also see how many views your most recent posts have garnered and the average actions by post type. This last metric is especially useful because it shows you which type of content your Google+ audience likes best based on how many times they’ve interacted with it.
Lastly, under Audience you can view how many followers you have and, if you have at least 200, can view followers by country, gender and age.

4. Facebook
Facebook’s analytics tool is also called “Insights” and can be accessed through your business or community page. Using Facebook Insights, you can better understand your audience, monitor what type of content is working, and find the best ways to connect with your target demographic.
Use the Overview tab to get a snapshot of what’s happened on your page in the past seven days and check out the Likes tab to view total page likes and net likes (the number of new likes minus the number of unlikes).
The Reach tab allows you to view post reach, likes, comments, and shares, as well as hide and report as spam reports and unlikes. The Visits tab gives information about page and tab visits and external referrers. This allows you to see where on the Internet people are coming from to get to your Facebook page, and where on the page they’re going once they’re there.

Use the Posts section to see when your fans are online and what posts they liked the most. You can also view the success of different post types based on engagement and average reach in this tab.
Lastly, use the People tab to find out the following information about your fans, people reached, and people engaged:
- Gender
- Age
- Language
- Country of residence
- City of residence
Conclusion
The integration of social media analytics on these platforms has made it incredibly easy to see which post types your audience on each network prefers. This will not only make your social media strategy more effective, but will help you better engage with prospects and drive more potential customers to your site.


